- Build a vote matrix — each row is an MP, each column is a vote. Values are +1 (YES), -1 (NO), or 0 (anything else: absent, abstained, excused).
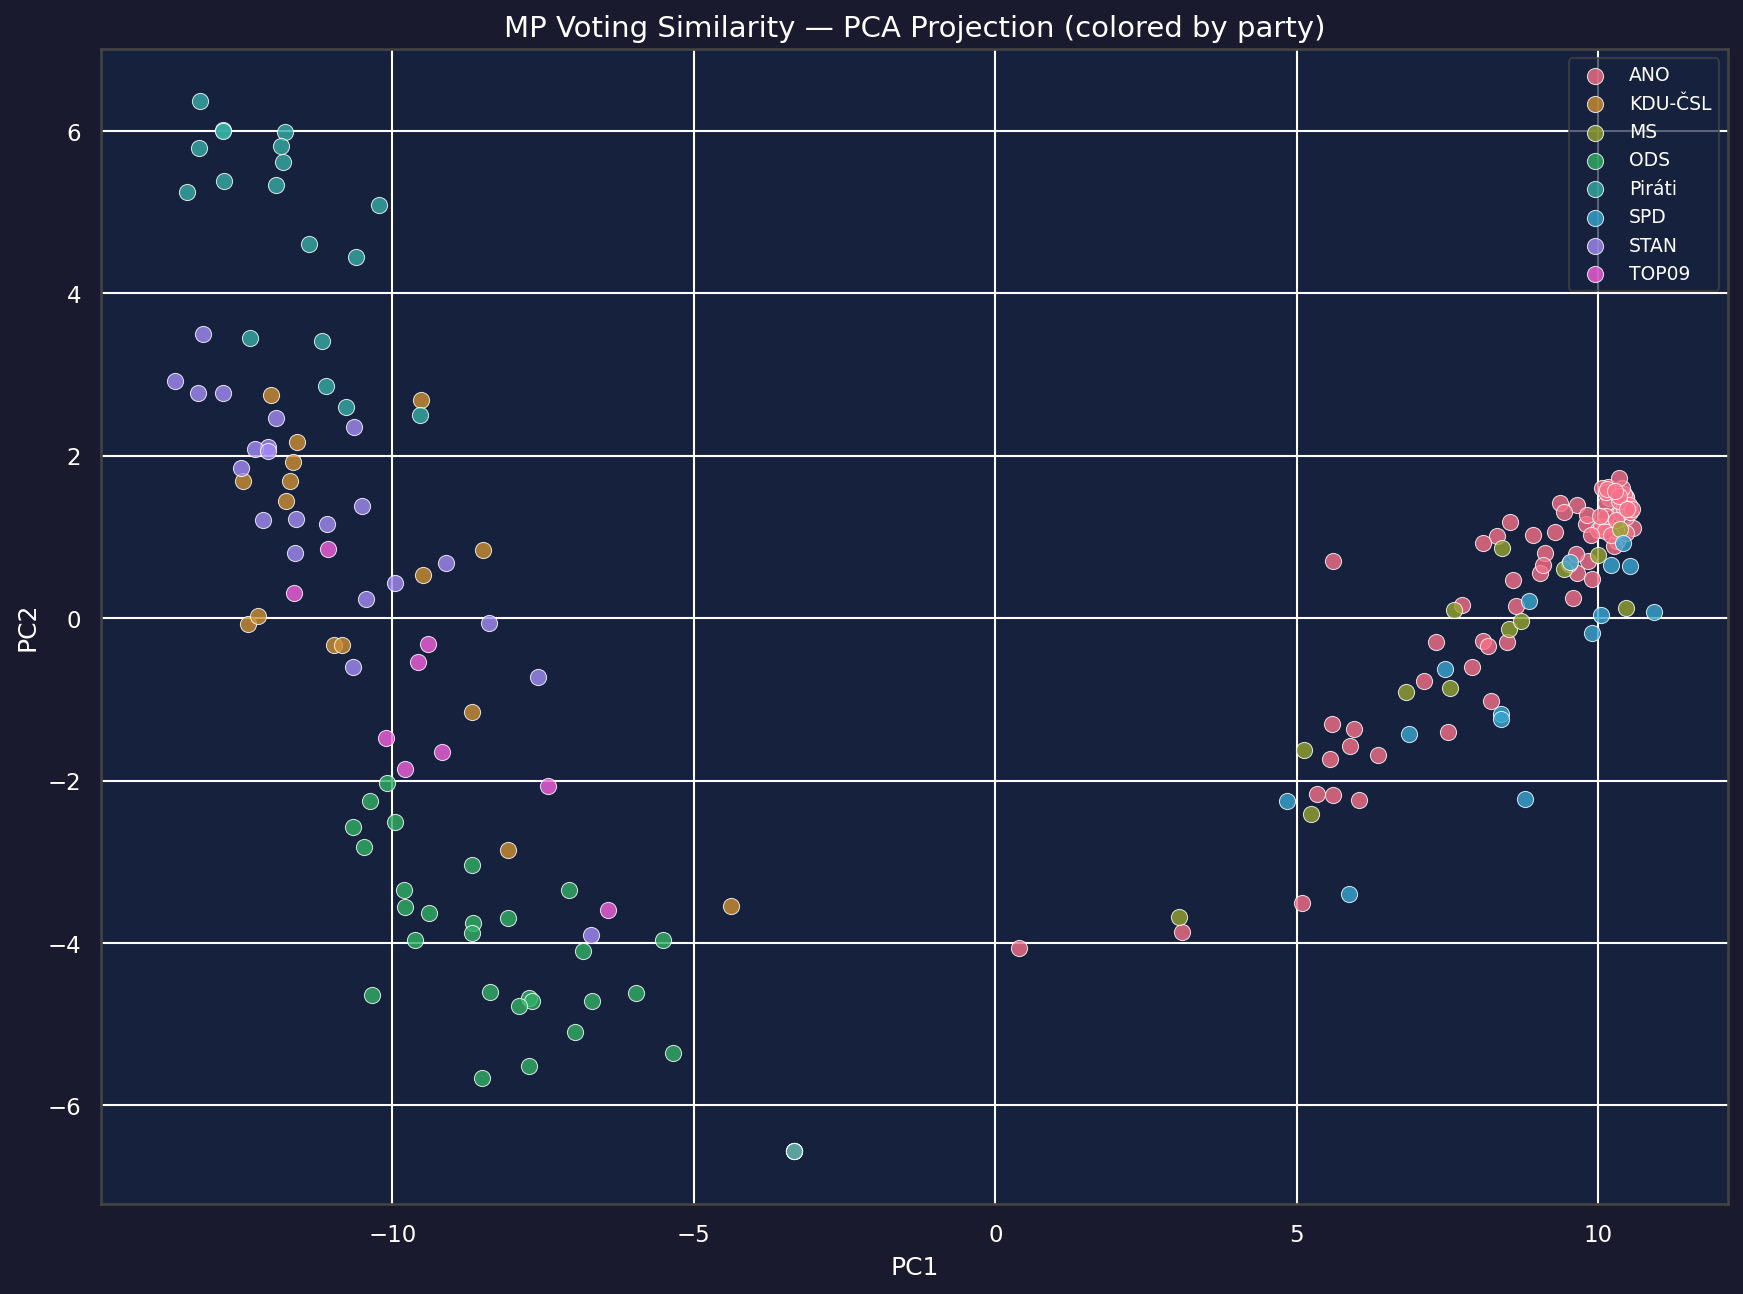
- PCA projection — Principal Component Analysis reduces the high-dimensional vote matrix to 2 dimensions for visualization. MPs with similar voting records cluster together.
- Cosine similarity — for the pairwise table, we compute cosine similarity between each pair of MPs' voting vectors. A score of 100% means they voted identically on every vote.
The cross-party pairs table shows the most similar MP pairs who belong to different parties — revealing hidden alliances.